Help
Main Tasks
The Binance Data page offers a unique opportunity to receive crucial analytical data on all cryptocurrency symbols in the spot market
of the Binance exchange. This data is specially designed for traders aiming to maximize their profits through short-term strategies such
as scalping. Key indicators are updated every few minutes, allowing you to stay informed about the latest market changes.
Users will be able to see important indicators such as trading volume dynamics, price growth probabilities, changes in buyer and seller
volumes, and other critically important indicators. This data helps quickly assess the current market situation, identify promising
entry and exit opportunities, and make informed decisions based on up-to-date information.
Binance Data is a powerful tool for scalpers, minimizing the time spent on market analysis and monitoring, and greatly enhancing the
chances of successful and profitable trades. Subscribe to access Binance Data and gain an edge over other traders by using advanced
analytical tools and real-time information.
Data Page
This is how the Binance Data page looks.
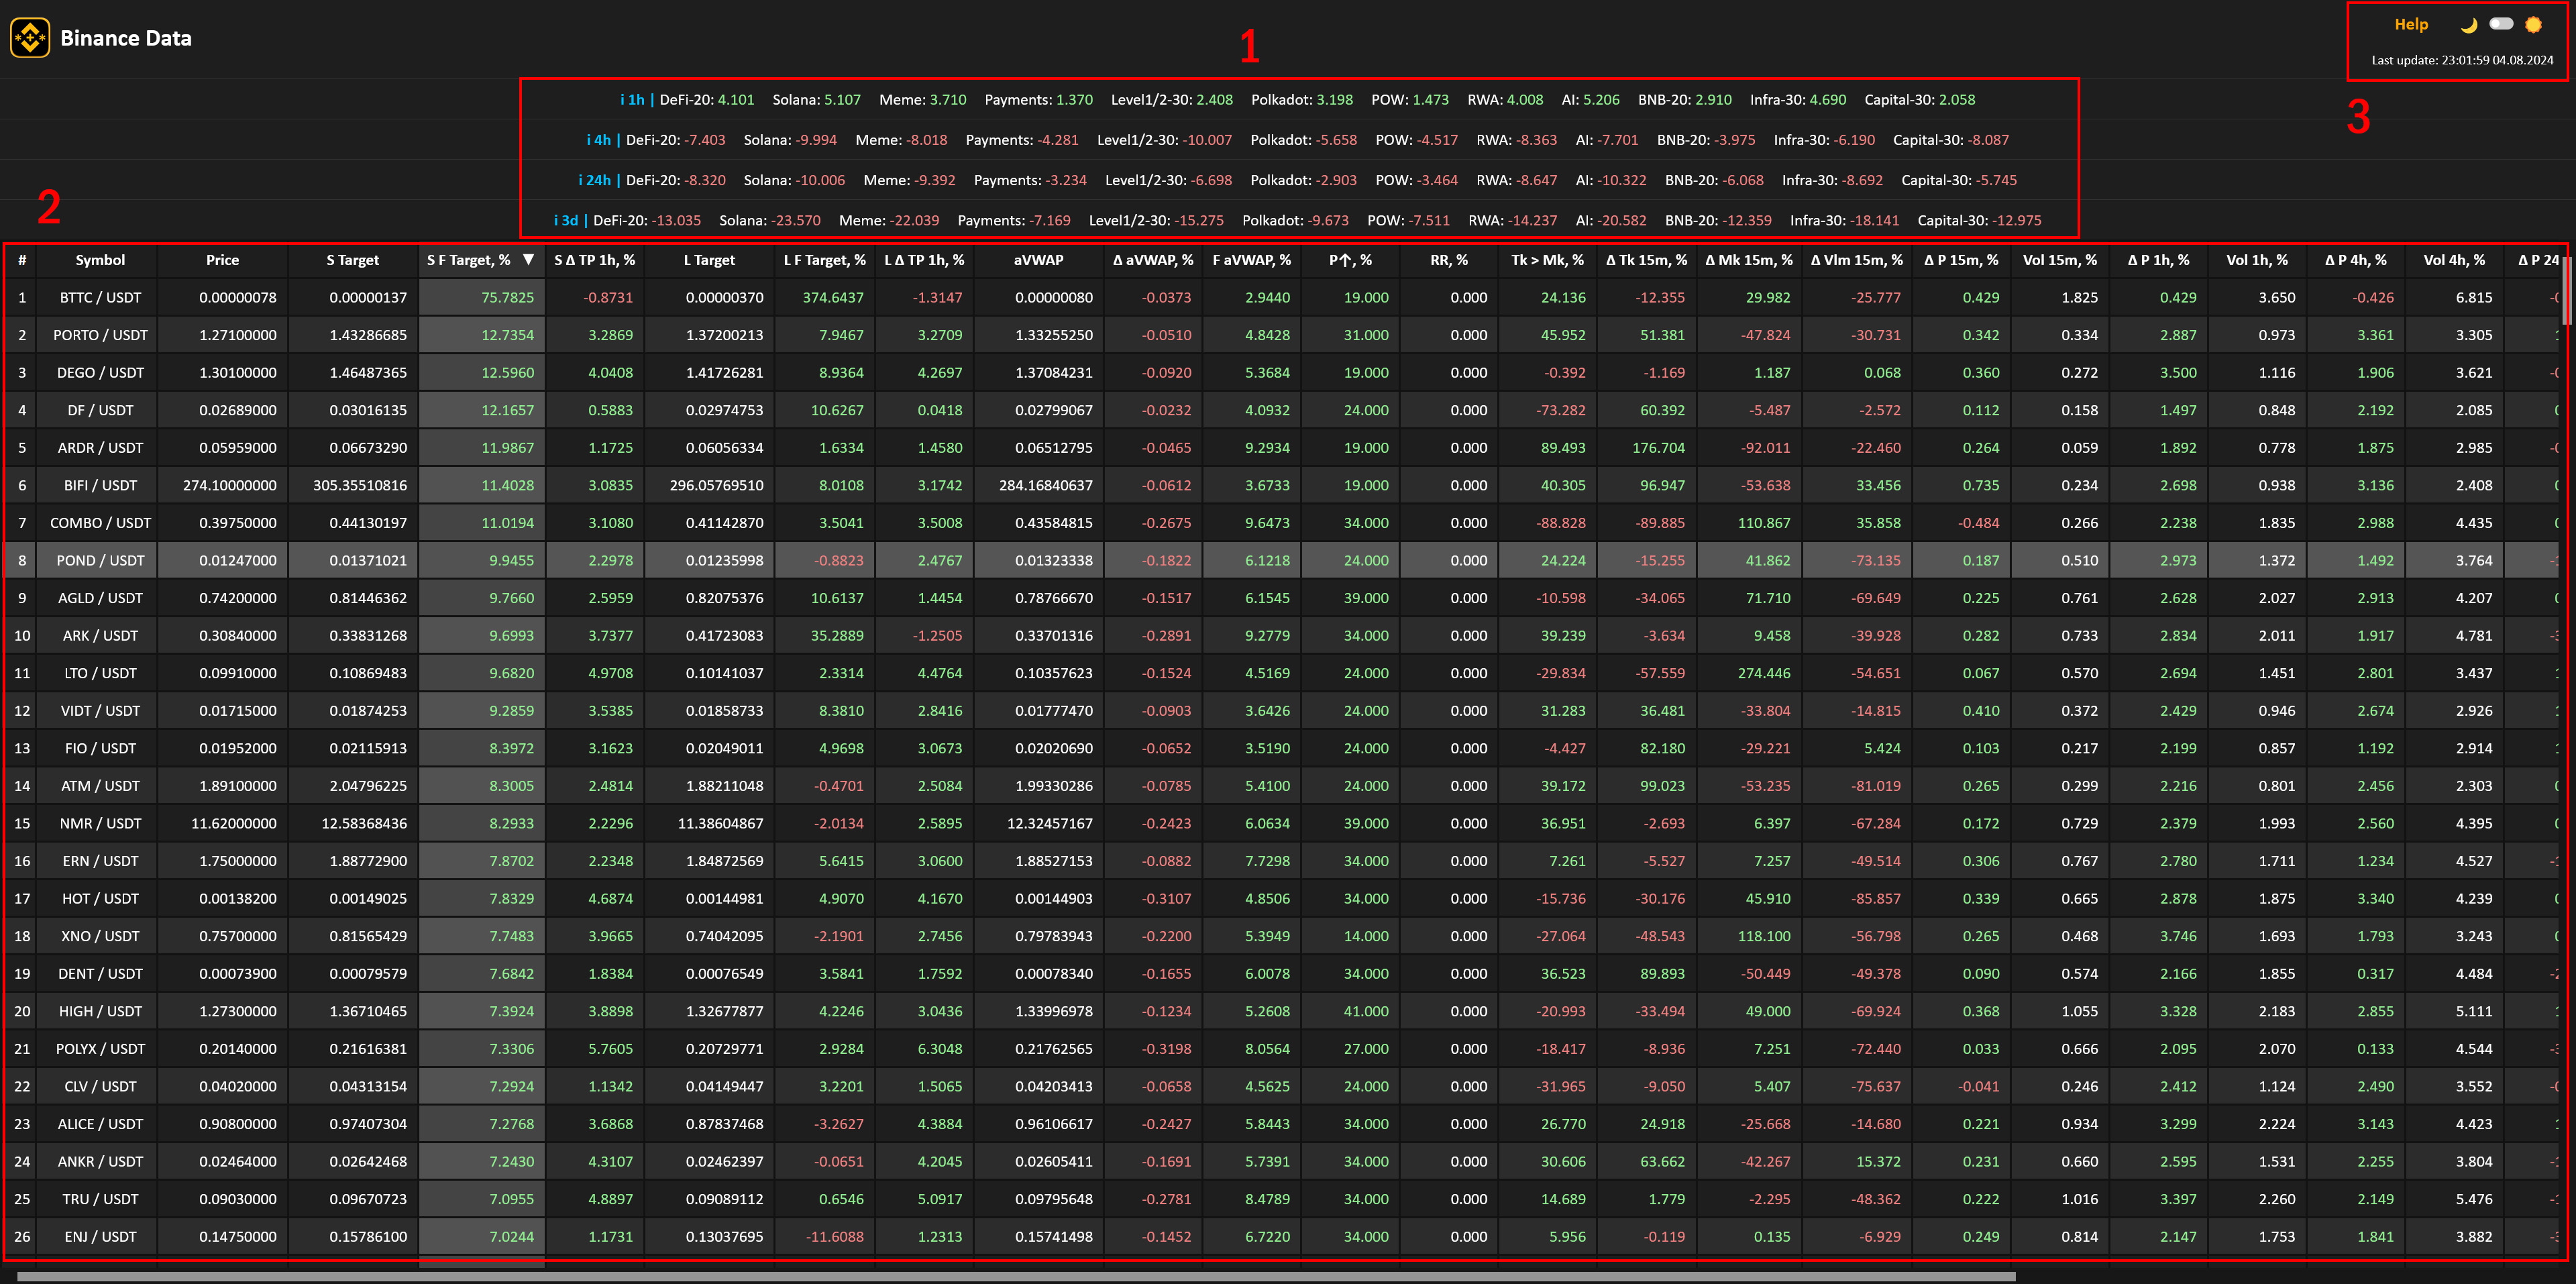
The page consists of 3 main sections:
-
Indices
Displays the current cryptocurrency index data by sector in three periods. Detailed in the Indices section.
-
Table with data for all cryptocurrencies
Displays the entire available set of calculated data for each cryptocurrency. Detailed in the Table section.
-
Site Theme Switcher and Last Data Update Time
Below the site color scheme switcher, the time of the last data update on the screen according to the server time is displayed.
Indexes
The cryptocurrency market indices block is located at the top of the page above the main data table.
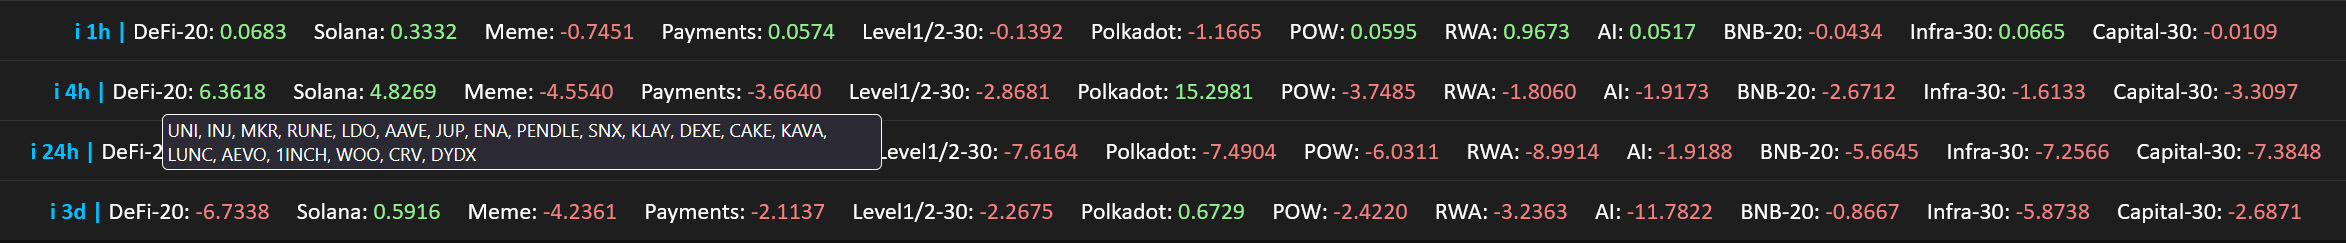
The indices block presents indicators for various market sectors. Each column corresponds to a specific sector, and the rows display
index values for different periods.
- i 1h: indices for the last hour.
- i 4h: indices for the last 4 hours.
- i 24h: indices for the last 24 hours.
- i 3d: indices for the last 3 days.
An index is a composite indicator that reflects the trading momentum in a cryptocurrency market sector. The index calculation includes
data on price, trading volume, volume change over the period, the change in the taker-to-maker ratio, and volatility. Each symbol's
contribution to the index depends on its capitalization and trading volume. All symbols in the sector may participate in the index calculation,
and in this case, the index does not have a number after its name, for example, "Solana". If the sector includes a large number of symbols,
only the number of symbols specified by the number after the index name participate in the index calculation, for example, the top 20
symbols in the "DeFi-20" index.
A positive index value indicates strong upward momentum. A zero or near-zero value indicates uncertainty
or market stagnation. A negative value indicates downward momentum.
Hover over the index name to see the symbols participating in its calculation.
The most valuable situation is when the index initially had a significant negative value in all periods, and then turned positive
first in i 1h, and later in i 4h. This can indicate a market reversal. The greater the difference
between the negative value in i 24h or i 3d and the positive value in i 1h, the
stronger the upward momentum.
This momentum can be initiated by the main symbols of the sector. If the momentum is strong enough, it will eventually affect symbols
with smaller capitalizations. The scalper gains a temporary advantage, allowing them to quickly assess the situation and, upon confirmation
of positive momentum, open a trade.
The main task of the indices is to detect a sector reversal at an early stage.
This rule also applies to the transition of indices from positive to negative values. It is not recommended to open long positions when
the entire index block is "red", that is, showing negative values.
Note that some symbols can belong to multiple sectors simultaneously. Especially if these symbols are not market capitalization leaders,
it is worth paying attention to them. If the indices of the sectors to which these symbols belong start to show growth, it is possible that
the symbols themselves will also start to grow soon.
Table
The data table for all cryptocurrencies occupies the main part of the page:
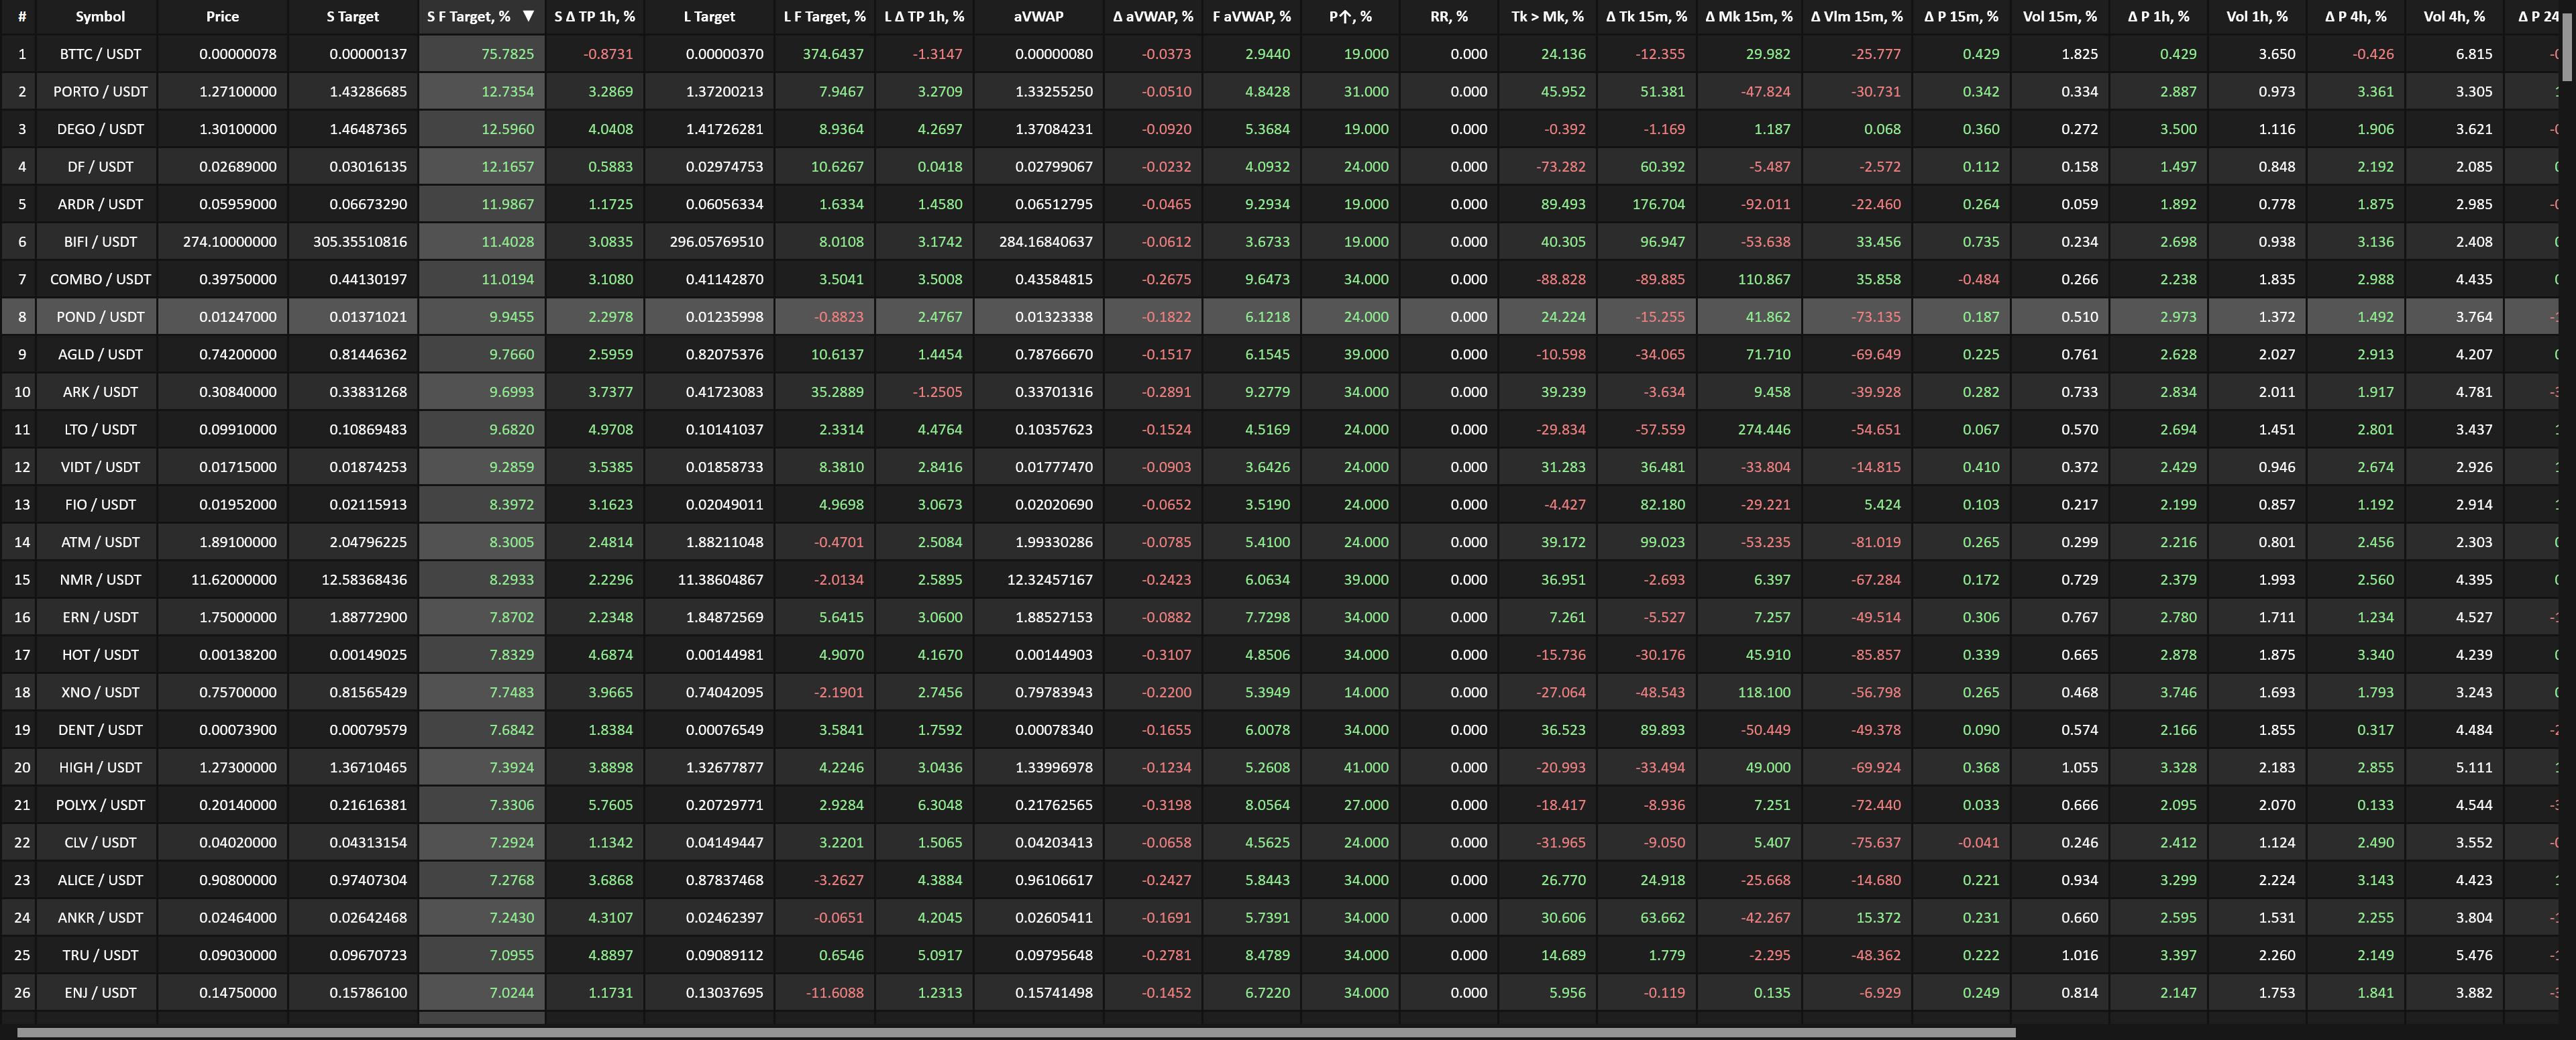
The table provides detailed information on all cryptocurrency symbols, allowing traders to quickly navigate the current market situation.
Each column in the table reflects key indicators calculated using carefully selected algorithms and analytical models. Below you will
find a detailed description of each column, including the name, calculation methods, and the significance of the data presented in the column.
- # - Row number in the table. The number of rows corresponds to the number of symbols currently traded on Binance exchange.
- Symbol - The name of the cryptocurrency symbol.
- Price - The last recorded price of the symbol.
- S Target - The price expected by traders in the near future. Calculated by a neural network based on trader behavior in the market.
- S F Target, % - The percentage difference between the last price of the symbol and the price expected by traders in the near future.
- S ∆ TP 1h, % - The percentage change in the expected price by traders in the near future over the last hour.
- L Target - The price expected by traders in the medium term. Calculated by a neural network based on trader behavior in the market.
- L F Target, % - The percentage difference between the last price of the symbol and the price expected by traders in the medium term.
- L ∆ TP 1h, % - The percentage change in the expected price by traders in the medium term over the last hour.
- aVWAP - The anchor VWAP value for this symbol. The anchor for the VWAP calculation starts from the beginning of the trend found
in the last 72 hours (3 days).
- ∆ aVWAP, % - The percentage change in aVWAP over the last 60 minutes. It is necessary to understand the index's dynamics.
- F aVWAP, % - The strength of the aVWAP index in percentage. Indicates how much the last aVWAP value is higher than
the last price. The higher this value, the greater the potential for rapid growth for this symbol. A negative value indicates that
the last price is already higher than aVWAP.
- P↑, % - The probability of a symbol's price increase in the near future, estimated based on more than 20 different parameters
of technical analysis and technical indicators for this symbol.
- RR, % - Rally Rate, the potential for a rally growth for this symbol, expressed as a percentage.
Calculated based on trading indicators presented in columns 10-21, as well as analysis of consecutive candles
and price dynamics in the current and previous calculation periods. Additionally, metrics such as volatility, volume,
time metrics, and others are used to adjust and finally determine the rally probability. The higher this indicator,
the greater the potential for growth found in the price movement, and the more interesting this symbol can be for
a scalper at this time.
- Tk > Mk, % - The dominance of takers over makers in the market of this symbol in the last 15 minutes, expressed as
a percentage. One of the important early indicators, a positive value of which, when supported by other indicators, may signal
a market reversal upwards. A positive value of this indicator combined with other signals indicating a market decline
points to a continued decline.
- ∆ Tk 15m, % - The change in the share of takers in the market over the last 15 minutes compared to the previous 15 minutes,
expressed as a percentage. A positive value shows the percentage inflow of takers to the market of this symbol over the last 15 minutes.
It is very important to analyze together with the indicator from columns 10 and 13.
- ∆ Mk 15m, % - The change in the share of makers in the market over the last 15 minutes compared to the previous 15 minutes,
expressed as a percentage. A positive value shows the percentage inflow of makers to the market of this symbol over the last 15 minutes.
It is very important to analyze together with the indicator from columns 10 and 13.
- ∆ Vlm 15m, % - The change in the trading volume in the market over the last 15 minutes compared to the previous 15 minutes,
expressed as a percentage. A positive value shows the percentage increase in trading volume in the market of this symbol over
the last 15 minutes. It is very important to analyze together with the indicators from columns 10, 11, and 12.
- ∆ P 15m, % - The change in the price of the symbol over the last 15 minutes, expressed as a percentage.
- Vol 15m, % - Volatility over the last 15 minutes, expressed as a percentage.
- ∆ P 1h, % - The change in the price of the symbol over the last 1 hour, expressed as a percentage.
- Vol 1h, % - Volatility over the last 1 hour, expressed as a percentage.
- ∆ P 4h, % - The change in the price of the symbol over the last 4 hours, expressed as a percentage.
- Vol 4h, % - Volatility over the last 4 hours, expressed as a percentage.
- ∆ P 24h, % - The change in the price of the symbol over the last 24 hours, expressed as a percentage.
- Vol 24h, % - Volatility over the last 24 hours, expressed as a percentage.
- Vol 3d, % - Volatility over the last 3 days, expressed as a percentage.
- PiT, % - Price in Trend, price in the trend over a large period - 3 days. Expressed as a percentage.
Calculated as follows: an upward or downward trend over the last 3 days is found, and the difference
between the average prices on the candle at the beginning of the trend and the candle at the end of the trend is taken as 100%;
then it is calculated at what level as a percentage relative to this difference the current price of the symbol is. If the value is positive, it means the largest trend found over 3 days is upward,
if negative - downward. For example, a value of 80% means that in the last three days an upward trend was detected, for example,
from a price of 2.0 to 3.0, but then the price dropped and is now 2.8. Also, for example, a value of -80% means that in the last 3 days
a downward trend was detected, for example, from a price of 3.0 to 2.0, but then the price rose to 2.2. This indicator, as well as a similar
indicator over a short period - 1 day - "S PiT, %" is convenient to use for understanding whether there was a local price pullback from the resistance or support level.
- TDR, % - Trend Duration Ratio, what part of the large period - 3 days - the found trend occupied.
Expressed as a percentage. For example, if the lowest price was on the first candle of this period (3 days), and the highest price during this
time is on the last candle of the period, then the value of this indicator will be 100%, i.e., the trend occupies the entire period. The higher this value, the more pronounced the trend found in the period.
- TLI, % - Trend Linearity Index, the index of trend linearity over a large period - 3 days. Expressed
as a percentage. The difference between the maximum and minimum price in the found trend is divided by the sum of all price fluctuations. The higher this value,
the more linear the price movement within the found trend from minimum to maximum (or vice versa), meaning the more pronounced
the trend and the stronger the impulse within it. The lower this value, the greater the price fluctuations within the found
trend and the lesser the impulse within it.
The data in the table can be sorted in ascending or descending order by any column with numerical data, as well as by the symbol name.
To sort, click on the desired column header, and the sort direction will be displayed next to the name. To change the sort direction,
click on the same column header again. By default, the first click on the column header selects descending order. Click on a row within
the table to highlight it. This is convenient if you need to shift your gaze from one monitor to another.
Telegram Channel
All subscribers are provided access to the private Telegram channel "Crypto Oracle". This channel publishes current index values for
the main cryptocurrency market zones, as well as signals for detected significant price growth.
The main purpose of this Telegram channel is to provide convenient access to indices from a mobile device for those who do not have
the ability to view the full data table at the moment and to draw traders' attention to symbols that are expected to experience price
growth in the near future.
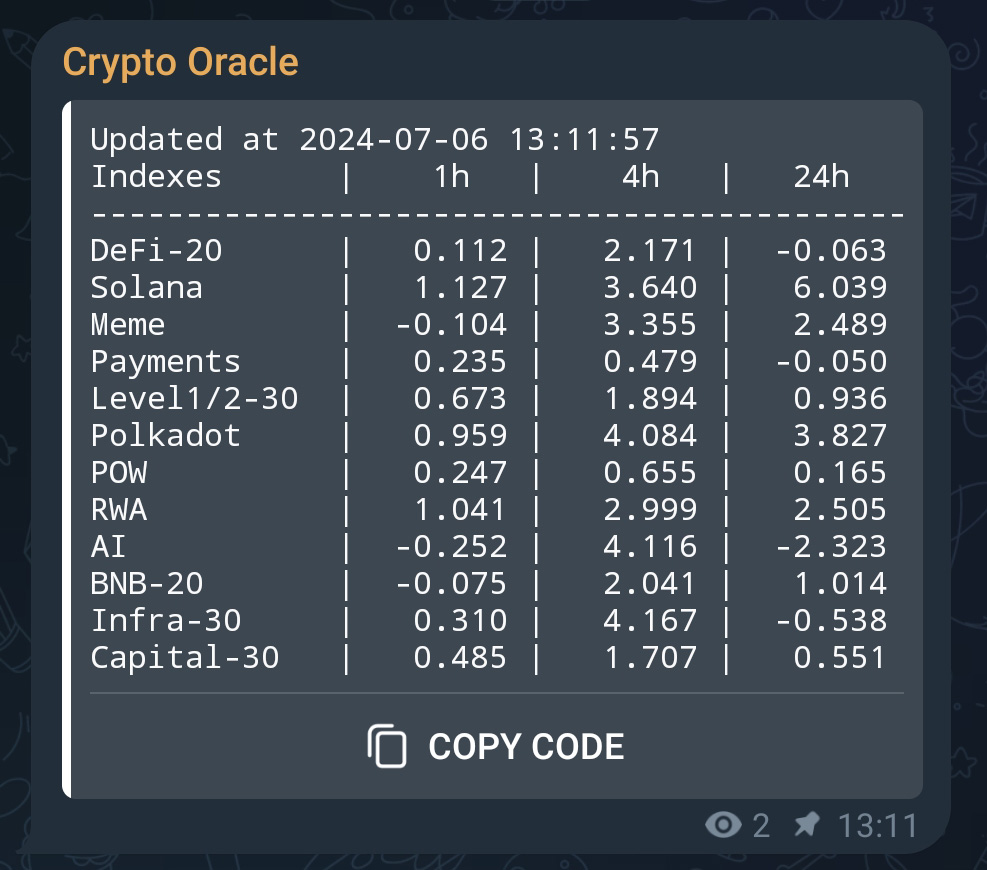
Indexes in Telegram
Information about indices by zones (sectors) of the cryptocurrency market is always placed in a pinned message in our Telegram channel.
When the values of the indices change, the content of the pinned message is updated, ensuring that it always contains up-to-date information.
The information is presented in a tabular format, where each row corresponds to the index of a separate market zone (sector). The columns indicate
the index values for various time periods.
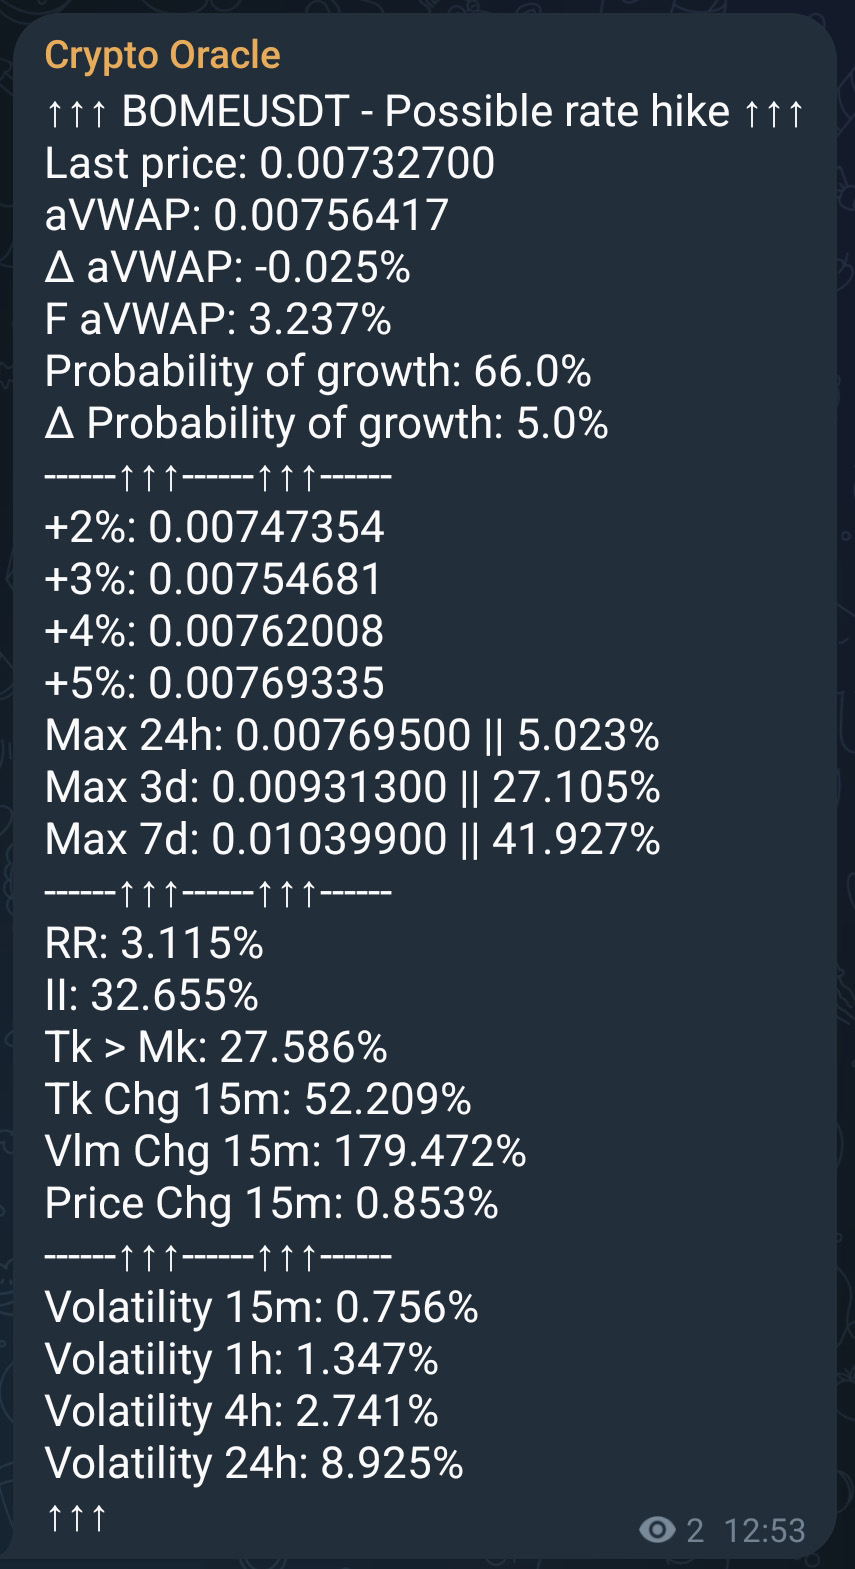
Signal in Telegram
Example of a message with a signal about a significant price movement of a symbol:
The text of the signal message contains the following information:
- Name of the symbol indicating the expected direction of price movement.
- Last price - The last recorded price of the symbol.
- aVWAP - The anchor VWAP value for this symbol. The starting point for calculating the VWAP is the beginning of the
detected trend over the last 72 hours (3 days).
- ∆ aVWAP, % - Change in the aVWAP value in percentage over the last 60 minutes. This is necessary to understand the
dynamics of the index.
- F aVWAP, % - The strength of the aVWAP index in percentage. Indicates how much the last aVWAP value is above the
last price. The higher this value, the greater the potential for a quick rise of this symbol. A negative value indicates that the
last price is already higher than the aVWAP.
- Probability of growth - The probability of the symbol's price rising in the near future, evaluated based on more
than 20 different technical analysis parameters and technical indicators for this symbol.
- ∆ Probability of growth - How much the probability of the symbol's price growth has changed after the last significant
price movement. Essentially, this is the change in the probability of price growth that triggered this signal message in the Telegram channel.
- +2% - +5% - Calculated symbol price values considering a rise by the indicated percentage. Provided
as a reference for the trader's convenience.
- Max 24h, Max 3d, Max 7d - The maximum price values of the symbol recorded over the
last 24 hours, 3 days, and 7 days, respectively. The percentage above the current symbol price is indicated after the vertical bar.
Provided as a reference for the trader's convenience.
- RR - Rally Rate, the potential for a possible rally in the growth of this symbol, expressed as a percentage.
It is calculated based on trading indicators, as well as the analysis of consecutive candles and price dynamics in the current and
previous calculation periods. Additionally, metrics such as volatility, volume, time metrics, and others are used to adjust and
finally determine the probability of a rally. The higher this value, the greater the potential for growth found in the price movement,
and the more interest this symbol may represent for the scalper at this time.
- II - Interest Index, the interest index for this symbol, expressed as a percentage. It is calculated based on trend indicators.
The higher this value, the greater the potential for growth found in the price movement, and the more interest this symbol may represent
for the scalper at this time.
- Tk > Mk - The predominance of takers over makers in the market of this symbol in the last 15 minutes, expressed as
a percentage. One of the important early indicators, a positive value of which, supported by other indicators, may signal a market
reversal upwards. A positive value of this indicator, combined with other signals indicating a market decline, indicates a continuation
of the decline.
- Tk Chg 15m - Change in the share of takers in the market over the last 15 minutes compared to the previous 15 minutes,
expressed as a percentage. A positive value shows the percentage inflow of takers into the market of this symbol over the last 15 minutes.
- Vlm Chg 15m - Change in the trading volume in the market over the last 15 minutes compared to the previous 15 minutes,
expressed as a percentage. A positive value shows the percentage by which the trading volume of this symbol's market has increased
over the last 15 minutes.
- Price Chg 15m - Change in the symbol's price over the last 15 minutes in percentage.
- Volatility 15m, Volatility 1h, Volatility 4h, Volatility 24h -
Volatility of the symbol over the last 15 minutes, 1 hour, 4 hours, 24 hours, respectively. Provided as a reference for the trader's convenience.
Important! This signal in the Telegram channel is not a recommendation to open a long position on the symbol. It simply draws
the trader's attention to this symbol so that the trader can first investigate all the data about it and not miss a possible price rise.
Tips
Current tips for working with the provided data:
- To find which symbol to open a long position on, sort the data in descending order by the column with the growth probability P↑, %.
Pay attention to symbols with the highest values. Values above 45 are particularly valuable. Additionally, ensure the F aVWAP, %
value is positive and as high as possible. If a symbol shows a growth impulse, it is highly likely to reach the aVWAP level.
- To find which symbol to open a long position on, sort the data in descending order by the column with the Interest Index II, %.
Pay attention to symbols with the highest values.
- To find which symbol to open a long position on, sort the data in descending order by the column with the Rally Probability RR, %.
Pay attention to symbols with the highest values.
- To find which symbol to open a long position on, sort the data in descending order by the column with the predominance of takers over makers
Tk > Mk, %. Pay attention to symbols with the highest values. Among them, look for symbols with high positive values of
∆ Tk 15m, % and ∆ Vlm 15m, % - this may indicate that the symbol is at the beginning of an upward trend.
- Avoid opening a long position if the Tk > Mk, % and ∆ Tk 15m, % values are positive, but the
∆ Vlm 15m, % value is negative or minimally positive.
- In short periods, Fibonacci support and resistance levels perform very well.
- To find which symbol to open a long position on, sort the data in descending order by the column with the long period trend price
L PiT, %. Focus first on symbols with positive values between 60% and 70%. If the short period trend price S PiT, %
is also positive and small, this may indicate a rebound after a pullback. Evaluate other data for this symbol, as it may be of great interest,
especially if it has high TDR and TLI values in both the long and short periods.
- If the long period trend price L PiT, % is above 61% or 38%, but near these values, and the short period trend price
S PiT, % is negative, this may indicate a rebound, with the price moving down but potentially reversing soon at
Fibonacci levels.
- Avoid opening a long position if the long period trend price L PiT, % is above 90%. The local growth impulse may
already be running out.
- Avoid opening a long position if the long period trend price L PiT, % is above 100%. This may be due to speculative
manipulations by "whales" in the market. Wait for the impulse to end and for a pullback to occur.
- To keep the row with the required symbol visible when updating data in the table, enable sorting by the symbol name and highlight
the row with the desired symbol with the mouse.
- Use the search function on the page (Ctrl+F) to quickly move to the row with the desired symbol.
How to Register
For registration instructions, go to the Registration section.
Ayuda
Tareas Principales
La página Binance Data ofrece una oportunidad única para recibir datos analíticos cruciales sobre todos los símbolos de criptomonedas
en el mercado spot de la bolsa Binance. Estos datos están especialmente diseñados para los traders que buscan maximizar sus ganancias
a través de estrategias a corto plazo, como el scalping. Los indicadores clave se actualizan cada pocos minutos, lo que le permite estar
al tanto de los últimos cambios del mercado.
Los usuarios podrán ver indicadores importantes como la dinámica del volumen de operaciones, la probabilidad de crecimiento de los precios,
los cambios en los volúmenes de compradores y vendedores, y otros indicadores críticamente importantes. Estos datos ayudan a evaluar
rápidamente la situación actual del mercado, identificar oportunidades prometedoras para entrar y salir de operaciones y tomar decisiones
informadas basadas en información actualizada.
Binance Data es una herramienta poderosa para los scalpers, que minimiza el tiempo dedicado al análisis y monitoreo del mercado, y aumenta
significativamente las posibilidades de operaciones exitosas y rentables. Suscríbase para acceder a Binance Data y obtenga una ventaja
sobre otros traders utilizando herramientas analíticas avanzadas e información actualizada en tiempo real.
Página de Datos
Así es como se ve la página de Binance Data.
La página consta de 3 secciones principales:
-
Índices
Muestra los datos actuales de los índices de criptomonedas por sector en tres períodos. Detallado en la sección Índices
-
Tabla con datos de todas las criptomonedas
Muestra el conjunto completo de datos calculados para cada criptomoneda. Detallado en la sección Tabla
-
Interruptor de tema del sitio y hora de la última actualización de datos
Debajo del interruptor del esquema de colores del sitio se muestra la hora de la última actualización de datos en la pantalla según la hora del servidor.
Índices
El bloque de índices del mercado de criptomonedas se encuentra en la parte superior de la página sobre la tabla de datos principales.
El bloque de índices presenta indicadores de varios sectores del mercado. Cada columna corresponde a un sector específico y las filas
muestran los valores de los índices para diferentes períodos.
- i 1h: índices de la última hora.
- i 4h: índices de las últimas 4 horas.
- i 24h: índices de las últimas 24 horas.
- i 3d: índices de los últimos 3 días.
Un índice es un indicador compuesto que refleja el impulso comercial en un sector del mercado de criptomonedas. El cálculo del índice
incluye datos sobre el precio, el volumen de operaciones, el cambio de volumen durante el período, el cambio en la relación entre takers
y makers, y la volatilidad. La contribución de cada símbolo al índice depende de su capitalización y volumen de operaciones. Todos los
símbolos del sector pueden participar en el cálculo del índice y, en este caso, el índice no tiene un número después de su nombre, por
ejemplo, "Solana". Si el sector incluye un gran número de símbolos, solo la cantidad de símbolos especificada por el número después del
nombre del índice participa en el cálculo del índice, por ejemplo, los 20 símbolos principales en el índice "DeFi-20".
Un valor positivo del índice indica un fuerte impulso alcista. Un valor cero o cercano a cero indica
incertidumbre o estancamiento del mercado. Un valor negativo indica un impulso bajista.
Pase el cursor sobre el nombre del índice para ver los símbolos que participan en su cálculo.
La situación más valiosa es cuando el índice inicialmente tenía un valor negativo significativo en todos los períodos y luego se volvió
positivo primero en i 1h y luego en i 4h. Esto puede indicar una reversión del mercado. Cuanto mayor
sea la diferencia entre el valor negativo en i 24h o i 3d y el valor positivo en i 1h,
más fuerte será el impulso alcista.
Este impulso puede ser iniciado por los símbolos principales del sector. Si el impulso es lo suficientemente fuerte, eventualmente afectará
a los símbolos con menor capitalización. El scalper obtiene una ventaja temporal, lo que le permite evaluar rápidamente la situación y,
al confirmar el impulso positivo, abrir una operación.
La tarea principal de los índices es detectar una reversión del sector en una etapa temprana.
Esta regla también se aplica a la transición de índices de valores positivos a negativos. No se recomienda abrir posiciones largas cuando
todo el bloque de índices está "rojo", es decir, muestra valores negativos.
Tenga en cuenta que algunos símbolos pueden pertenecer a varios sectores simultáneamente. Especialmente si estos símbolos no son líderes
en capitalización de mercado, vale la pena prestarles atención. Si los índices de los sectores a los que pertenecen estos símbolos comienzan
a mostrar crecimiento, es posible que los propios símbolos también comiencen a crecer pronto.
Tabla
La tabla de datos para todas las criptomonedas ocupa la parte principal de la página:
La tabla proporciona información detallada sobre todos los símbolos de criptomonedas, lo que permite a los traders navegar rápidamente
por la situación actual del mercado. Cada columna de la tabla refleja indicadores clave calculados utilizando algoritmos y modelos
analíticos cuidadosamente seleccionados. A continuación, encontrará una descripción detallada de cada columna, incluidos el nombre,
los métodos de cálculo y el significado de los datos presentados en la columna.
- # - Número de fila en la tabla. La cantidad de filas corresponde a la cantidad de símbolos que se están negociando
actualmente en la bolsa Binance.
- Symbol - Nombre del símbolo de la criptomoneda.
- Price - El último precio registrado del símbolo.
- S Target - Precio esperado por los traders en el corto plazo. Se calcula mediante una red neuronal basada en el comportamiento
de los traders en el mercado.
- S F Target, % - Diferencia porcentual entre el último precio del símbolo y el precio esperado por los traders en el corto plazo.
- S ∆ TP 1h, % - Cambio en la última hora del precio esperado por los traders en el corto plazo en porcentaje.
- L Target - Precio esperado por los traders en el mediano plazo. Se calcula mediante una red neuronal basada en el comportamiento
de los traders en el mercado.
- L F Target, % - Diferencia porcentual entre el último precio del símbolo y el precio esperado por los traders en el mediano plazo.
- L ∆ TP 1h, % - Cambio en la última hora del precio esperado por los traders en el mediano plazo en porcentaje.
- aVWAP - Valor de anchor VWAP para este símbolo. El ancla para iniciar el cálculo de VWAP se toma del inicio de la tendencia
encontrada en las últimas 72 horas (3 días).
- ∆ aVWAP, % - Cambio en el valor de aVWAP en porcentaje en los últimos 60 minutos. Es necesario para comprender la dinámica del índice.
- F aVWAP, % - Fuerza del índice aVWAP en porcentaje. Indica cuánto el último valor de aVWAP está por encima del último precio.
Cuanto mayor es este valor, mayor es el potencial de rápido crecimiento de este símbolo. Un valor negativo indica que el último precio ya es superior al aVWAP.
- P↑, % - Probabilidad de aumento del precio del símbolo en el corto plazo, evaluada en función de más de 20 parámetros
diferentes de análisis técnico e indicadores técnicos para este símbolo.
- RR, % - Rally Rate, el potencial de un posible rally de crecimiento para este símbolo, expresado en porcentaje.
Se calcula en base a indicadores comerciales presentados en las columnas 10-21, así como en el análisis de velas consecutivas
y la dinámica del precio en los períodos de cálculo actual y anterior. Se utilizan métricas adicionales como volatilidad, volumen,
métricas de tiempo y otras para ajustar y determinar finalmente la probabilidad de un rally. Cuanto mayor sea este valor,
mayor es el potencial de crecimiento encontrado en el movimiento del precio, y mayor es el interés que este símbolo puede representar
para el scalper en este momento.
- Tk > Mk, % - Predominio de takers sobre makers en el mercado de este símbolo en los últimos 15 minutos, expresado en
porcentaje. Uno de los primeros indicadores importantes, cuyo valor positivo junto con otros indicadores puede señalar
un cambio en el mercado hacia arriba. Un valor positivo de este indicador combinado con otras señales que indican una caída en el mercado
sugiere la continuación de la caída.
- ∆ Tk 15m, % - Cambio en la participación de takers en el mercado en los últimos 15 minutos en comparación con los 15 minutos anteriores,
expresado en porcentaje. Un valor positivo indica el porcentaje de afluencia de takers en el mercado de este símbolo en los últimos 15 minutos.
Es muy importante analizarlo junto con los indicadores de las columnas 10 y 13.
- ∆ Mk 15m, % - Cambio en la participación de makers en el mercado en los últimos 15 minutos en comparación con los 15 minutos anteriores,
expresado en porcentaje. Un valor positivo indica el porcentaje de afluencia de makers en el mercado de este símbolo en los últimos 15 minutos.
Es muy importante analizarlo junto con los indicadores de las columnas 10 y 13.
- ∆ Vlm 15m, % - Cambio en el volumen de transacciones en el mercado en los últimos 15 minutos en comparación con los 15 minutos anteriores,
expresado en porcentaje. Un valor positivo indica el porcentaje de aumento en el volumen de transacciones en el mercado de este símbolo en
los últimos 15 minutos. Es muy importante analizarlo junto con los indicadores de las columnas 10, 11 y 12.
- ∆ P 15m, % - Cambio en el precio del símbolo en los últimos 15 minutos, expresado en porcentaje.
- Vol 15m, % - Volatilidad en los últimos 15 minutos, expresada en porcentaje.
- ∆ P 1h, % - Cambio en el precio del símbolo en la última hora, expresado en porcentaje.
- Vol 1h, % - Volatilidad en la última hora, expresada en porcentaje.
- ∆ P 4h, % - Cambio en el precio del símbolo en las últimas 4 horas, expresado en porcentaje.
- Vol 4h, % - Volatilidad en las últimas 4 horas, expresada en porcentaje.
- ∆ P 24h, % - Cambio en el precio del símbolo en las últimas 24 horas, expresado en porcentaje.
- Vol 24h, % - Volatilidad en las últimas 24 horas, expresada en porcentaje.
- Vol 3d, % - Volatilidad en los últimos 3 días, expresada en porcentaje.
- PiT, % - Price in Trend, precio en tendencia de un período largo - 3 días. Expresado en porcentaje.
Se calcula de la siguiente manera: se encuentra una tendencia alcista o bajista en los últimos 3 días y se toma el 100% de la diferencia
de los precios medios en la vela del inicio de la tendencia y en la vela del final de la tendencia; luego se calcula en qué nivel
porcentual relativo a esta diferencia se encuentra el precio actual del símbolo. Si el valor es positivo, significa que la mayor tendencia
encontrada en los últimos 3 días es alcista, si es negativo, es bajista. Por ejemplo, un valor del 80% significa que en los últimos tres días
se encontró una tendencia alcista, por ejemplo, de un precio de 2.0 a 3.0, pero luego el precio bajó y ahora es 2.8. También, por ejemplo,
un valor de -80% significa que en los últimos 3 días se encontró una tendencia bajista, por ejemplo, de un precio de 3.0 a 2.0,
pero luego el precio subió a 2.2. Este indicador, así como un indicador similar en un período corto - 1 día - "S PiT, %", es útil
para comprender si ha ocurrido una reversión local del precio desde un nivel de resistencia o soporte.
- TDR, % - Trend Duration Ratio, qué parte del período largo - 3 días - ocupó la tendencia encontrada.
Expresado en porcentaje. Por ejemplo, si el precio más bajo estuvo en la primera vela de este período (3 días) y el precio más alto
en este tiempo se encuentra en la última vela del período, el valor de este indicador será del 100%, es decir, la tendencia ocupa
todo el período. Cuanto mayor es este valor, más claramente se ha encontrado una tendencia en el período.
- TLI, % - Trend Linearity Index, índice de linealidad de la tendencia en el período largo - 3 días. Expresado
en porcentaje. La diferencia entre el precio máximo y mínimo en la tendencia encontrada se divide por la suma de todas las fluctuaciones del precio.
Cuanto mayor es este valor, más lineal ha sido el movimiento del precio dentro de la tendencia encontrada desde el mínimo hasta el máximo
(o viceversa), lo que significa que esta tendencia es más fuerte y tiene un impulso más fuerte. Cuanto menor es este valor,
mayores han sido las fluctuaciones del precio dentro de la tendencia encontrada y menor es el impulso en ella.
Los datos en la tabla se pueden ordenar en orden ascendente o descendente por cualquier columna con datos numéricos, así como por el
nombre del símbolo. Para ordenar, haga clic en el encabezado de la columna deseada y la dirección de la ordenación se mostrará junto al
nombre. Para cambiar la dirección de la ordenación, haga clic en el mismo encabezado de la columna nuevamente. De forma predeterminada,
el primer clic en el encabezado de la columna selecciona el orden descendente. Haga clic en una fila dentro de la tabla para resaltarla.
Esto es conveniente si necesita cambiar la mirada de un monitor a otro.
Canal de Telegram
Para todos los suscriptores se proporciona acceso al canal privado de Telegram "Crypto Oracle". En este canal se publican los valores
actuales de los índices para las principales zonas del mercado de criptomonedas, así como señales de crecimiento significativo de precios detectado.
El objetivo principal de este canal de Telegram es proporcionar un acceso conveniente a los índices desde un dispositivo móvil para aquellos
que no tienen la posibilidad de ver la tabla de datos completa en ese momento y atraer la atención de los traders a los símbolos que
se espera que experimenten un crecimiento de precios en el futuro cercano.
Índices en Telegram
La información sobre los índices por zonas (sectores) del mercado de criptomonedas siempre se coloca en un mensaje fijado en nuestro canal de Telegram.
Cuando los valores de los índices cambian, el contenido del mensaje fijado se actualiza, garantizando que siempre contenga información actualizada.
La información se presenta en formato tabular, donde cada fila corresponde al índice de una zona (sector) del mercado. Las columnas indican
los valores del índice para varios períodos de tiempo.
Señal en Telegram
Ejemplo de un mensaje con una señal sobre un movimiento significativo del precio de un símbolo:
El texto del mensaje de señal contiene la siguiente información:
- Nombre del símbolo con la dirección prevista del movimiento del precio.
- Last price - Último precio registrado del símbolo.
- aVWAP - Valor del VWAP anclado para este símbolo. El punto de inicio para calcular el VWAP es el comienzo de la
tendencia detectada en las últimas 72 horas (3 días).
- ∆ aVWAP, % - Cambio en el valor del aVWAP en porcentaje durante los últimos 60 minutos. Es necesario para comprender
la dinámica del índice.
- F aVWAP, % - La fuerza del índice aVWAP en porcentaje. Indica cuánto el último valor del aVWAP está por encima del
último precio. Cuanto mayor sea este valor, mayor será el potencial de rápido crecimiento de este símbolo. Un valor negativo indica
que el último precio ya está por encima del aVWAP.
- Probability of growth - La probabilidad de que el precio del símbolo suba en un futuro próximo, evaluada en base
a más de 20 parámetros diferentes de análisis técnico e indicadores técnicos para este símbolo.
- ∆ Probability of growth - Cuánto ha cambiado la probabilidad de que el precio del símbolo suba después del último
movimiento significativo del precio. En esencia, este es el cambio en la probabilidad de que el precio suba lo que provocó la aparición
de este mensaje de señal en el canal de Telegram.
- +2% - +5% - Valores calculados del precio del símbolo considerando un aumento en el porcentaje indicado.
Se proporciona como referencia para la conveniencia del trader.
- Max 24h, Max 3d, Max 7d - Valores máximos del precio del símbolo registrados en las
últimas 24 horas, 3 días y 7 días, respectivamente. Después de la barra vertical, se indica en qué porcentaje este valor está por
encima del precio actual del símbolo. Se proporciona como referencia para la conveniencia del trader.
- RR - Rally Rate, el potencial para un posible rally de crecimiento de este símbolo, expresado en porcentaje.
Se calcula en base a indicadores comerciales, así como al análisis de velas consecutivas y la dinámica del precio en los períodos
de cálculo actual y anterior. Además, se utilizan métricas como la volatilidad, el volumen, las métricas de tiempo y otras para
ajustar y determinar finalmente la probabilidad de un rally. Cuanto mayor sea el valor de este indicador, mayor será el potencial
de crecimiento encontrado en el movimiento del precio, y mayor interés puede representar este símbolo para el scalper en este momento.
- II - Interest Index, el índice de interés para este símbolo, expresado en porcentaje. Se calcula en base a indicadores
de tendencia. Cuanto mayor sea el valor de este indicador, mayor será el potencial de crecimiento encontrado en el movimiento del precio,
y mayor interés puede representar este símbolo para el scalper en este momento.
- Tk > Mk - Predominio de los takers sobre los makers en el mercado de este símbolo en los últimos 15 minutos,
expresado en porcentaje. Uno de los indicadores tempranos importantes, cuyo valor positivo apoyado por otros indicadores puede señalar
una reversión del mercado al alza. Un valor positivo de este indicador combinado con otras señales que indican una caída del mercado,
indica la continuación de la caída.
- Tk Chg 15m - Cambio en la participación de los takers en el mercado durante los últimos 15 minutos en comparación
con los 15 minutos anteriores, expresado en porcentaje. Un valor positivo muestra el porcentaje de afluencia de takers en el mercado
de este símbolo durante los últimos 15 minutos.
- Vlm Chg 15m - Cambio en el volumen de operaciones en el mercado durante los últimos 15 minutos en comparación
con los 15 minutos anteriores, expresado en porcentaje. Un valor positivo muestra el porcentaje en que el volumen de operaciones
en el mercado de este símbolo ha aumentado en los últimos 15 minutos.
- Price Chg 15m - Cambio en el precio del símbolo durante los últimos 15 minutos en porcentaje.
- Volatility 15m, Volatility 1h, Volatility 4h, Volatility 24h -
La volatilidad del símbolo durante los últimos 15 minutos, 1 hora, 4 horas, 24 horas, respectivamente. Se proporciona como referencia para la conveniencia del trader.
¡Importante! Esta señal en el canal de Telegram no es una recomendación para abrir una posición larga en el símbolo.
Simplemente atrae la atención del trader a este símbolo para que el trader investigue primero todos los datos sobre él y no se pierda
el posible inicio de un aumento de precio.
Consejos
Consejos actuales sobre el trabajo con los datos presentados:
- Para encontrar un símbolo para abrir una posición larga, ordene los datos de manera descendente por la columna con la probabilidad de
crecimiento P↑, %. Preste atención a los símbolos con los valores más altos. Los valores superiores a 45 son de
especial interés. Asegúrese de que el valor de F aVWAP, % sea positivo y lo más alto posible. Si se detecta un impulso
de crecimiento en un símbolo, es probable que alcance el nivel de aVWAP.
- Para encontrar un símbolo para abrir una posición larga, ordene los datos de manera descendente por la columna con el Índice de Interés
II, %. Preste atención a los símbolos con los valores más altos.
- Para encontrar un símbolo para abrir una posición larga, ordene los datos de manera descendente por la columna con la probabilidad de rally
RR, %. Preste atención a los símbolos con los valores más altos.
- Para encontrar un símbolo para abrir una posición larga, ordene los datos de manera descendente por la columna con la predominancia de los
tomadores sobre los creadores Tk > Mk, %. Preste atención a los símbolos con los valores más altos. Busque entre ellos aquellos
símbolos que también tengan grandes valores positivos de ∆ Tk 15m, % y ∆ Vlm 15m, %; es posible
que este símbolo esté al inicio de una tendencia alcista.
- No abra una posición larga si los valores de Tk > Mk, % y ∆ Tk 15m, % son positivos, pero el valor de
∆ Vlm 15m, % es negativo o mínimamente positivo.
- En períodos cortos, los niveles de soporte y resistencia de Fibonacci funcionan muy bien.
- Para encontrar un símbolo para abrir una posición larga, ordene los datos de manera descendente por la columna con el precio en tendencia
de largo período L PiT, %. Preste atención primero a los símbolos cuyo valor sea positivo y esté entre el 60% y el 70%.
Si el valor del precio en tendencia de corto período S PiT, % también es positivo y pequeño, puede significar que ha
comenzado un rebote después de una corrección. Evalúe otros datos de este símbolo, ya que puede ser de gran interés, especialmente si
tiene valores altos de TDR y TLI en los períodos largo y corto.
- Si el valor del precio en tendencia de largo período L PiT, % es superior al 61% o al 38%, pero está cerca de estos valores
y el valor del precio en tendencia de corto período S PiT, % es negativo, puede significar que ha ocurrido un rebote,
el precio está bajando, pero puede revertirse en niveles de Fibonacci en el futuro cercano.
- No abra una posición larga si el valor del precio en tendencia de largo período L PiT, % es superior al 90%.
Es posible que el impulso de crecimiento local ya esté agotado.
- No abra una posición larga si el valor del precio en tendencia de largo período L PiT, % es superior al 100%.
Esto parece ser una manipulación especulativa de los "peces gordos" en el mercado. Espere a que termine el impulso y espere una corrección.
- Para que la fila con los datos del símbolo deseado no se pierda de vista al actualizar los datos en la tabla, habilite la clasificación
por el nombre del símbolo y seleccione la fila del símbolo deseado con el mouse.
- Use la búsqueda en la página (Ctrl+F) para moverse rápidamente a la fila del símbolo deseado.
Cómo registrarse
Para obtener instrucciones de registro, vaya a la sección Registro.
Справка
Основные задачи
На странице Binance Data представлена уникальная возможность получать важные аналитические данные по всем криптовалютным символам
спотового рынка биржи Binance. Эти данные специально разработаны для трейдеров, стремящихся максимизировать свою прибыль за счет
краткосрочных стратегий, таких как скальпинг. Каждые несколько минут обновляются ключевые индикаторы, что позволяет вам оставаться
в курсе самых свежих изменений на рынке.
Пользователи смогут увидеть такие важные показатели, как динамика объема торгов, вероятность роста цен, изменения объемов покупателей
и продавцов, а также другие критически важные индикаторы. Эти данные помогают быстро оценивать текущую рыночную ситуацию, выявлять
перспективные возможности для входа и выхода из сделок и принимать обоснованные решения на основе актуальной информации.
Binance Data — это мощный инструмент для скальперов, который минимизирует время, затрачиваемое на анализ и мониторинг рынка, и
максимально повышает шансы на успешные и прибыльные сделки. Оформите платную подписку на доступ к данным Binance Data и получите
преимущество перед другими трейдерами, используя передовые аналитические инструменты и актуальную информацию в режиме реального времени.
Страница с данными
Так выглядит страница с данными Binance Data.
Страница состоит из 3 основных блоков:
-
Индексы
Отображает актуальные данные индексов криптовалют по секторам в трех периодах. Подробно описано в разделе Индексы
-
Таблица с данными по всем криптовалютам
Отображает весь доступный набор рассчитанных данных для каждой криптовалюты. Подробно описано в разделе Таблица
-
Переключатель темы сайта и время последнего обновления данных
Под переключателем цветовой схемы сайта отображается время последнего обновления данных на экране по времени сервера.
Индексы
Блок с индексами криптовалютного рынка расположен вверху страницы над таблицей с основными данными
В блоке индексов представлены показатели различных секторов рынка. Каждая колонка соответствует определенному сектору, а строки
отображают значения индексов за разные периоды.
- i 1h: индексы за последний час.
- i 4h: индексы за последние 4 часа.
- i 24h: индексы за последние 24 часа.
- i 3d: индексы за последние 3 дня.
Индекс – это композитный показатель, отображающий торговый импульс в секторе на криптовалютном рынке. В расчет индекса входят данные
по цене, торговому объему, изменению объема за период, изменению соотношения тейкеров и мейкеров, а также волатильности. Вклад каждого
символа в индекс зависит от его капитализации и объема торгов. В расчете индекса могут принимать участие либо все символы сектора и
тогда индекс не имеет после названия числа, например, "Solana". Если в секторе входит большое количество символов, то в расчете индекса
принимает участие только то количество символов, которое указано числом после названия индекса, например, 20 основных символов в
индексе "DeFi-20".
Положительное значение индекса указывает на сильный импульс к росту. Нулевое или околонулевое значение
говорит о неопределенности или затишье на рынке. Отрицательное значение указывает на импульс к падению.
Наведите курсор на название индекса, чтобы увидеть символы, участвующие в его расчете.
Наиболее ценна ситуация, когда индекс сначала имел значительное отрицательное значение во всех периодах, а затем стал положительным
сначала в i 1h, а затем и в i 4h. Это может свидетельствовать о развороте рынка. Чем больше разница между отрицательным значением
i 24h или i 3d и положительным значением i 1h, тем сильнее импульс к росту.
Этот импульс может быть инициирован основными символами сектора. Если импульс достаточно сильный, то он со временем затронет и символы
с меньшей капитализацией. Скальпер получает временное преимущество, позволяющее быстро оценить ситуацию и при подтверждении
положительного импульса открыть сделку.
Основная задача индексов – фиксировать разворот в секторе на раннем этапе.
Это правило применимо и в случае перехода индексов от положительных значений к отрицательным. Не рекомендуется открывать длинные
позиции, когда весь блок индексов «красный», то есть показывает отрицательные значения.
Обратите внимание, что некоторые символы могут принадлежать к нескольким секторам одновременно. Особенно если эти символы не являются
лидерами по капитализации, стоит присмотреться к ним, если индексы секторов, к которым относятся эти символы, начинают показывать рост,
возможно, в ближайшее время и сами символы тоже начнут расти.
Таблица
Таблица с данными по всем криптовалютам занимает основную часть страницы:
В таблице представлена детализированная информация по всем криптовалютным символам, что позволяет трейдерам быстро ориентироваться в
текущей рыночной ситуации. В каждой колонке таблицы отражены ключевые показатели, рассчитанные на основе тщательно подобранных алгоритмов
и аналитических моделей. Ниже вы найдете подробное описание каждого столбца, включая название, методы расчета и значение данных,
представленных в колонке.
- # - Номер строки в таблице. Количество строк соответствует количеству символов, торгуемых в настоящий момент на бирже Binance.
- Symbol - Название символа криптовалюты.
- Price - Последняя зарегистрированная цена символа.
- S Target - Цена, ожидаемая трейдерами в ближайшей перспективе. Рассчитывается нейросетью на основании поведения трейдеров на рынке.
- S F Target, % - Разница в процентах между последней ценой символа и ценой, ожидаемой трейдерами в ближайшей перспективе.
- S ∆ TP 1h, % - Изменение за последний час цены, ожидаемой трейдерами в ближайшей перспективе в процентах.
- L Target - Цена, ожидаемая трейдерами в среднесрочной перспективе. Рассчитывается нейросетью на основании поведения трейдеров на рынке.
- L F Target, % - Разница в процентах между последней ценой символа и ценой, ожидаемой трейдерами в среднесрочной перспективе.
- L ∆ TP 1h, % - Изменение за последний час цены, ожидаемой трейдерами в среднесрочной перспективе в процентах.
- aVWAP - Значение anchor VWAP для данного символа. Якорем для начала расчета VWAP берется начало найденного тренда
за последние 72 часа (3 дня).
- ∆ aVWAP, % - Изменение значения aVWAP в процентах за последние 60 минут. Необходимо для понимания динамики индекса.
- F aVWAP, % - Сила индекса aVWAP в процентах. Указывает, на сколько процентов последнее значение aVWAP выше, чем
последняя цена. Чем больше это значение, тем больший потенциал для быстрого роста у данного символа. Отрицательное значение говорит о том,
что последняя цена уже выше, чем aVWAP.
- P↑, % - Вероятность роста цены символа в ближайшее время, оцениваемая по более чем 20 различным параметрам
технического анализа и технических индикаторов по данному символу.
- RR, % - Rally Rate, потенциал для возможного ралли по росту для данного символа, выражается в процентах.
Рассчитывается на основе торговых показателей, представленных в колонках 10-21, а также на основе анализа последовательных свечей
и динамики цены в текущем и предыдущем расчетных периодах. Дополнительно используются метрики, такие как волатильность, объем,
метрики времени и другие, чтобы скорректировать и окончательно определить вероятность ралли. Чем выше значение этого показателя,
тем больший потенциал для роста найден в характере движения цены, и тем больше интереса данный символ может представлять для
скальпера в данное время.
- Tk > Mk, % - Преобладание тейкеров над мейкерами на рынке данного символа в последние 15 минут, выражается в
процентах. Один из важных ранних показателей, положительное значение которого при поддержке других показателей может сигнализировать
о развороте рынка вверх. Положительное значение этого показателя в сочетании с другими сигналами, сигнализирующими о падении рынка,
указывает на продолжение падения.
- ∆ Tk 15m, % - Изменение доли тейкеров на рынке за последние 15 минут по сравнению с предыдущими 15 минутами,
выражается в процентах. Положительное значение показывает процент притока тейкеров на рынок данного символа за последние 15 минут.
Очень важно анализировать совместно с показателем из колонки 10 и 13.
- ∆ Mk 15m, % - Изменение доли мейкеров на рынке за последние 15 минут по сравнению с предыдущими 15 минутами,
выражается в процентах. Положительное значение показывает процент притока мейкеров на рынок данного символа за последние 15 минут.
Очень важно анализировать совместно с показателем из колонки 10 и 13.
- ∆ Vlm 15m, % - Изменение объема сделок на рынке за последние 15 минут по сравнению с предыдущими 15 минутами,
выражается в процентах. Положительное значение показывает процент, на который возрос объем торгов на рынке данного символа за
последние 15 минут. Очень важно анализировать совместно с показателем из колонки 10, 11 и 12.
- ∆ P 15m, % - Изменение цены символа за последние 15 минут, выражается в процентах.
- Vol 15m, % - Волатильность за последние 15 минут, выражается в процентах.
- ∆ P 1h, % - Изменение цены символа за последний 1 час, выражается в процентах.
- Vol 1h, % - Волатильность за последний 1 час, выражается в процентах.
- ∆ P 4h, % - Изменение цены символа за последние 4 часа, выражается в процентах.
- Vol 4h, % - Волатильность за последние 4 часа, выражается в процентах.
- ∆ P 24h, % - Изменение цены символа за последние 24 часа, выражается в процентах.
- Vol 24h, % - Волатильность за последние 24 часа, выражается в процентах.
- Vol 3d, % - Волатильность за последние 3 дня, выражается в процентах.
- PiT, % - Price in Trend, цена в тренде большого периода - 3 дня. Выражается в процентах.
Рассчитывается следующим образом: находится восходящий или нисходящий тренд за последние 3 дня и за 100% принимается разница
средних цен на свече начала тренда и на свече окончания тренда; после этого рассчитывается на каком уровне в процентах относительно
этой разницы находится текущая цена символа. Если значение положительное, то значит самый большой найденный тренд за 3 дня растущий,
если отрицательное - падающий. Например, значение 80% означает, что за последние три дня был обнаружен растущий тренд, например,
с цены 2.0 до 3.0, но потом цена опустилась и сейчас составляет 2.8. Также, например, значение -80% означает, что за последние 3 дня
был обнаружен падающий тренд, например, с цены 3.0 до 2.0, но потом цена поднялась до 2.2. Этот показатель, а также аналогичный
показатель в малом периоде - 1 день - "S PiT, %" удобно использовать для понимания, произошел ли локальный откат цены от уровня
сопротивления или поддержки.
- TDR, % - Trend Duration Ratio, какую часть большого периода - 3 дня - занимал найденный тренд.
Выражается в процентах. Например, если самая низкая цена была в первой свече данного периода (3 дня), а самая высокая цена за это
время находится в последней свече периода, то значение этого показателя будет 100%, т.е. тренд занимает собой весь период. Чем
больше это значение, тем более ярко выраженный тренд найден в периоде.
- TLI, % - Trend Linearity Index, индекс линейности тренда в большом периоде - 3 дня. Выражается
в процентах. Разность максимальной и минимальной цены в найденном тренде делится на сумму всех колебаний цены. Чем выше это значение,
тем более линейно внутри найденного тренда двигалась цена от минимума к максимуму (или наоборот), значит, тем более сильно выражен
этот тренд и тем более сильный импульс в нем заложен. Чем ниже это значение, тем большие колебания цены были внутри найденного
тренда и тем меньший импульс в нем заложен.
Данные в таблице могут быть отсортированы по возрасстанию или убыванию значений в любой колонке с числовыми данными, а также по наименованию символа.
Для сортировки кликните мышкой по заголовку нужной колонки, при этом рядом с названием отобразится направление сортировки. Для изменения направления
сортировки кликните по этому же заголовку колонки еще раз. По-умолчанию, при первом нажатии на заголовок колонки выбирается сортировка по-убыванию.
Кликните по строке внутри таблицы, чтобы выделить строку. Это удобно, если необходимо переносить взгляд с одного монитора на другой.
Канал в Телеграм
Для всех подписчиков предоставляется доступ к приватному каналу Telegram "Crypto Oracle". В этом канале публикуются актуальные
значения индексов для основных зон крипторынка, а также сигналы об обнаруженном характерном росте цены.
Основная цель этого Telegram-канала — обеспечить удобный доступ к индексам с мобильного устройства для тех, у кого нет возможности
просмотреть полную таблицу данных в данный момент, и привлечь внимание трейдеров к символам, по которым ожидается рост цены в
ближайшее время.
Индексы в Телеграм
Информация об индексах по зонам (секторам) криптовалютного рынка всегда размещается в закрепленном сообщении в нашем Telegram-канале.
При изменении значений индексов содержимое закрепленного сообщения обновляется, гарантируя, что оно всегда содержит актуальную информацию.
Информация представлена в табличном виде, где каждая строка отвечает за индекс отдельной зоны (сектора) рынка. В колонках указаны
значения индекса для различных временных периодов.
Сигнал в Телеграм
Примерный вид сообщения с сигналом о характерном движении цены символа:
Текст сообщения с сигналом содержит следующую информацию:
- Название символа с указанием предполагаемого направления движения цены.
- Last price - Последняя зарегистрированная цена символа.
- aVWAP - Значение anchor VWAP для данного символа. Якорем для начала расчета VWAP берется начало найденного тренда
за последние 72 часа (3 дня).
- ∆ aVWAP, % - Изменение значения aVWAP в процентах за последние 60 минут. Необходимо для понимания динамики индекса.
- F aVWAP, % - Сила индекса aVWAP в процентах. Указывает, на сколько процентов последнее значение aVWAP выше, чем
последняя цена. Чем больше это значение, тем больший потенциал для быстрого роста у данного символа. Отрицательное значение говорит о том,
что последняя цена уже выше, чем aVWAP.
- Probability of growth - Вероятность роста цены символа в ближайшее время, оцениваемая по более чем 20 различным параметрам
технического анализа и технических индикаторов по данному символу.
- ∆ Probability of growth - На сколько изменилась вероятность роста цены символа после последнего характерного движения цены.
По сути, это какое изменение вероятности роста цены привело к появлению этого сигнального сообщения в канале Телеграм.
- +2% - +5% - Рассчитанные значения цены символа с учетом роста на указанное количество процентов.
Приводится справочно для удобства трейдера.
- Max 24h, Max 3d, Max 7d - Максимальное значения цены символа, которое было
зафиксировано в последние 24 часа, 3 дня и 7 дней соответственно. После вертикальной черты указано на сколько процентов это значение
выше текущей цены символа. Приводится справочно для удобства трейдера.
- RR - Rally Rate, потенциал для возможного ралли по росту для данного символа, выражается в процентах.
Рассчитывается на основе торговых показателей, а также на основе анализа последовательных свечей
и динамики цены в текущем и предыдущем расчетных периодах. Дополнительно используются метрики, такие как волатильность, объем,
метрики времени и другие, чтобы скорректировать и окончательно определить вероятность ралли. Чем выше значение этого показателя,
тем больший потенциал для роста найден в характере движения цены, и тем больше интереса данный символ может представлять для
скальпера в данное время.
- II - Interest Index, Индекс интереса к данному символу, выражается в процентах. Рассчитывается на основе
трендовых показателей. Чем выше значение этого показателя, тем больший потенциал для роста
найден в характере движения цены, и тем больше интереса данный символ может представлять для скальпера в данное время.
- Tk > Mk - Преобладание тейкеров над мейкерами на рынке данного символа в последние 15 минут, выражается в
процентах. Один из важных ранних показателей, положительное значение которого при поддержке других показателей может сигнализировать
о развороте рынка вверх. Положительное значение этого показателя в сочетании с другими сигналами, сигнализирующими о падении рынка,
указывает на продолжение падения.
- Tk Chg 15m - Изменение доли тейкеров на рынке за последние 15 минут по сравнению с предыдущими 15 минутами,
выражается в процентах. Положительное значение показывает процент притока тейкеров на рынок данного символа за последние 15 минут.
- Vlm Chg 15m - Изменение объема сделок на рынке за последние 15 минут по сравнению с предыдущими 15 минутами,
выражается в процентах. Положительное значение показывает процент, на который возрос объем торгов на рынке данного символа за
последние 15 минут.
- Price Chg 15m - Изменение цены символа за последние 15 минут в процентах.
- Volatility 15m, Volatility 1h, Volatility 4h, Volatility 24h -
Волатильность символа за последние 15 минут, 1 час, 4 часа, 24 часа соответственно. Приводится справочно для удобства трейдера.
Важно! Этот сигнал в канале Telegram не является рекомендацией для открытия длинной позиции по символу. Он просто
привлекает внимание трейдера к данному символу, чтобы трейдер в первую очередь исследовал все данные по нему и не упустил
возможное начало роста цены.
Советы
Актуальные советы по работе с представляемымы данными:
- Для поиска по какому символу открыть длинную позицию отсортируйте данные по-убыванию по колонке с вероятностью роста P↑, %.
Обратите внимание на символы, у которых эти значения максимальные. Ценность представляют значения этого показателя более 45. Обратите внимание,
чтобы при этом значение F aVWAP, % было положительным и как можно большим. Если у символа обнаружен импульс к росту, то он с
большой вероятностью дойдет до уровня aVWAP.
- Для поиска по какому символу открыть длинную позицию отсортируйте данные по-убыванию по колонке с Индексом Интереса II, %.
Обратите внимание на символы, у которых эти значения максимальные.
- Для поиска по какому символу открыть длинную позицию отсортируйте данные по-убыванию по колонке с вероятностью ралли RR, %.
Обратите внимание на символы, у которых эти значения максимальные.
- Для поиска по какому символу открыть длинную позицию отсортируйте данные по-убыванию по колонке с преобладанием тейкеров над мейкерами Tk > Mk, %.
Обратите внимание на символы, у которых эти значения максимальные. Найдите среди них символы, у которых также большие положительные значения
показателей ∆ Tk 15m, % и ∆ Vlm 15m, % - возможно этот символ находится в самом начале восходящего тренда.
- Не стоит открывать длинную позицию, если значения Tk > Mk, % и ∆ Tk 15m, % положительные, а значение ∆ Vlm 15m, %
отрицательное или минимальное положительное.
- На коротких периодах очень хорошо показывают себя уровни поддержки и сопротивления по Фибоначчи.
- Для поиска по какому символу открыть длинную позицию отсортируйте данные по-убыванию по колонке цена в тренде большого периода L PiT, %. В первую
очередь обратите внимание на символы, у которых этот показатель положительный и находится между 60% и 70%. Если при этом значение цены в тренде малого периода
S PiT, % также положительное и небольшое, то это может означать, что начался отскок после отката. Оцените другие данные по данному символу,
он может представлять большой интерес, особенно, если имеет большие значения TDR и TLI в большом и малом периоде.
- Если значение цены в тренде большого периода L PiT, % более 61% или 38%, но находится рядом с этими значениями и при этом значение
цены в тренде малого периода S PiT, % отрицательное, то это может означать, что произошел отскок, цена движется вниз, но в ближайшее время может
развернуться на уровнях Фибоначчи.
- Не стоит открывать длинную позицию, если значение цены в тренде большого периода L PiT, % более 90%. Возможно, что локальный импульс роста уже на исходе.
- Не стоит открывать длинную позицию, если значение цены в тренде большого периода L PiT, % более 100%. Это очень похоже на спекулятивные манипуляции "китов" на
рынке. Ожидайте окончания импульса и дождитесь отката.
- Чтобы строка с данными нужного символа не терялась из виду при обновлении данных в таблице включите сортировку по названию символа и
выделите мышкой строку с нужным вам символом.
- Используйте поиск на странице (Ctrl+F) для быстрого перемещения к строке с нужным символом.
Как зарегистрироваться
Для ознакомления с инструкцией по регистрации перейдите в раздел Регистрация